Large heap dump analysis with Eclipse Memory Analyzer
Jeroen Reijn
2010-10-06
Most developers working with Java hardly have to think about the memory footprint of their application that they wrote. The garbage collector inside the JVM will remove most waste, but what happens when not all waste can be removed or something is wrong inside the application? This may result in an exception that probably a lot of developers and system administrators have seen before: java.lang.OutOfMemoryError (OOME).
There are several causes for such an exception, but the most obvious is that there is memory leak somewhere in the application.
The situation
At one of my recent projects we were having some memory related issues on one of the production machines. The web application was running in Tomcat 6 and it appeared that at a certain point in time, the JVM tried to allocate twice the average memory it was using. Let's say from 2 Gb the memory footprint went up to 4GB. You might have guessed it, because only a couple of minutes later we were represented with the OOME message in the server log. It turned out that this was related to the amount and type of requests being handled by the application server. I was glad to find out it was not a memory leak, but more a warning that the total size of requests could allocate a lot of memory. If your application is running, it's hard to see what objects allocate memory. To get an insight on what the application was doing at the moment the OOME occurred, we configured the JVM to create a memory(heap) dump/snapshot at the moment that the OOME was thrown.
Generating a heap dump
Most of my clients run on the Sun(Oracle) JVM, so I will try to keep this post focussed on the instructions for the Sun JVM. In case your application server runs out of memory you can instruct the JVM to generate a heap dump when an OOME occurs. This heap dump will be generated in the HPROF binary format.
You can do this in by:
- Manually: by using 'jmap', which is available since JDK 1.5.
- Automatically by providing the following JVM command line parameter:
-XX:+HeapDumpOnOutOfMemoryError
The size of the heap dump is around the same size as the configured max heap size JVM parameter.
So if you have set your max heap size to -Xmx512m , your heap dump will be around that size.
Analyzing the heap dump
Now you have the heap dump and want to figure out what was inside the heap at the moment the OOME occurred. There are several Java heap dump analyzers out there, where most of them can do more then just heap analysis. The products range from commercial to open source and these are the ones that I tried with my 4Gb .hprof file:
I was surprised to see that most of the above applications were unable to handle a file of this size. Eclipse Memory Analyzer was actually the only heap dump analyzer that was able to handle a heap dump of this size on my MacBookPro. All the other analyzers were unable to handle a file of this size. Apparently some of these tools tried to load the entire file into memory. On a laptop with only 4 Gb this will not fit. Eclipse MAT was able to analyze this file within 5-10 minutes.
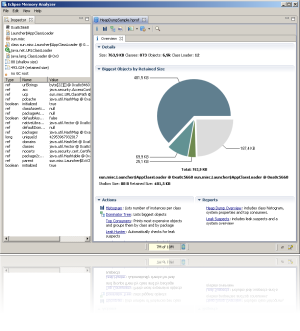
About Eclipse Memory Analyzer

One of the great things about Eclipse Memory Analyzer is that it starts indexing the heapdumps on first load. This makes the processing of the heapdump very fast and once you've parsed the entire heapdump, reopening it is a piece of cake, because it does not have to process it all over again.
Once you have the heapdump on your screen the dominator tree view is the most useful view and can give you a very good insight on what was loaded when the server ran out of memory.
Next, to the statistical views there is also an automatic leak hunter available to help you figure out the problem as fast as possible.
Summary
If you ever have to analyze a heap dump I would recommend to use Eclipse Memory Analyzer. It's fast, easy to use and free.

