Reporting Dashboard
Overview
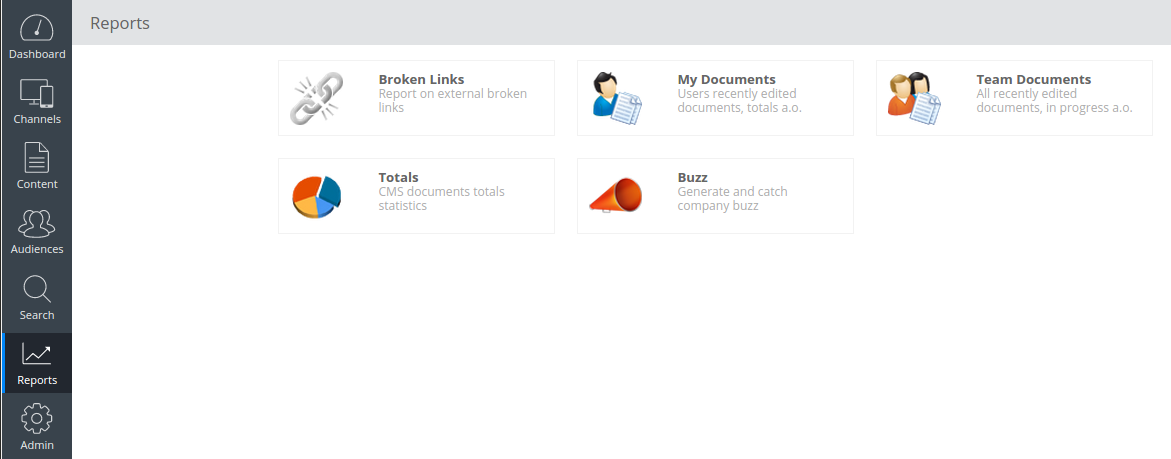
The reporting dashboard shows various reports, split up into five fixed groups:
-
My Documents
-
Team Documents
-
Totals
-
Buzz
Screenshots
Overview
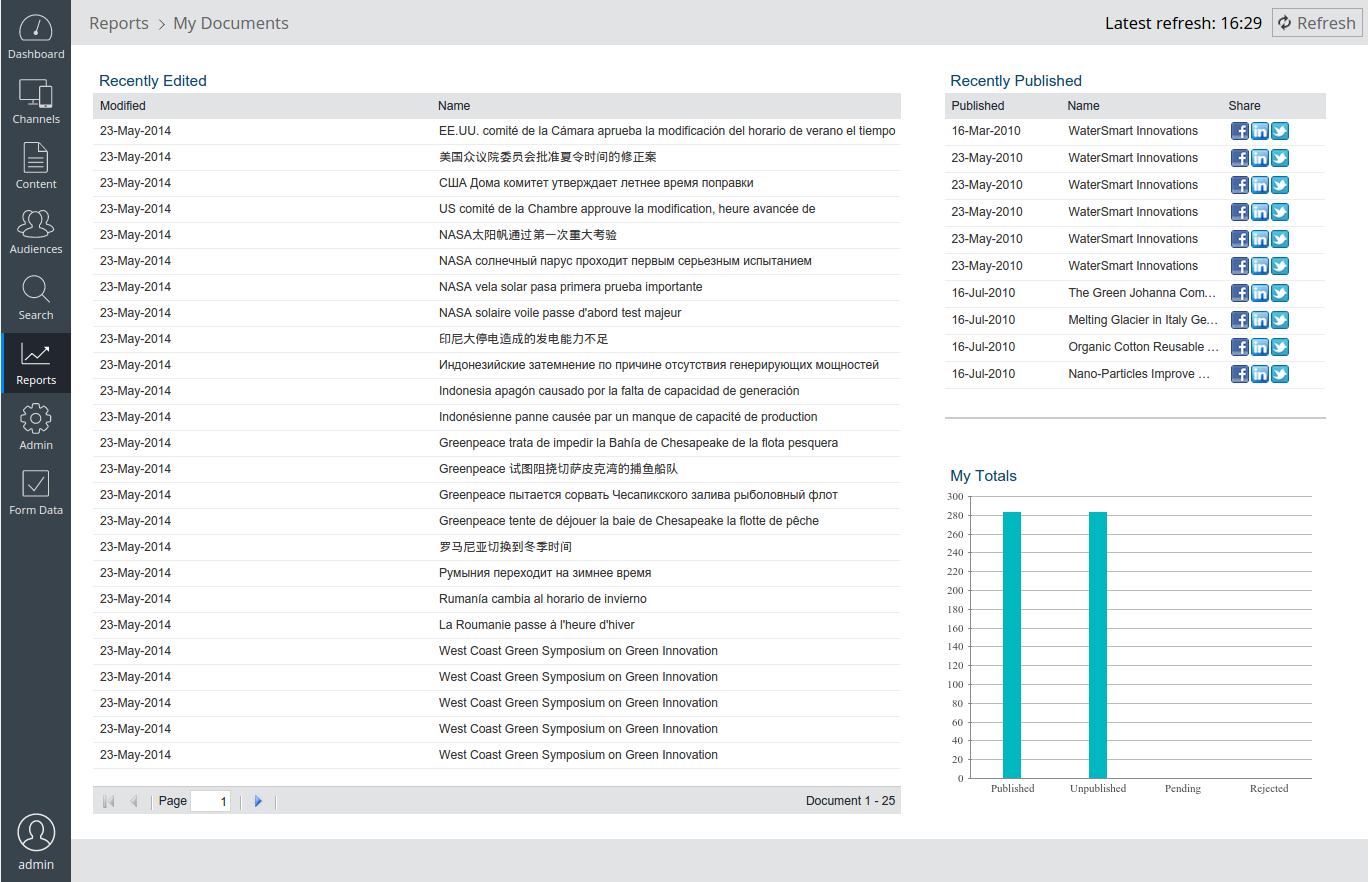
My Documents
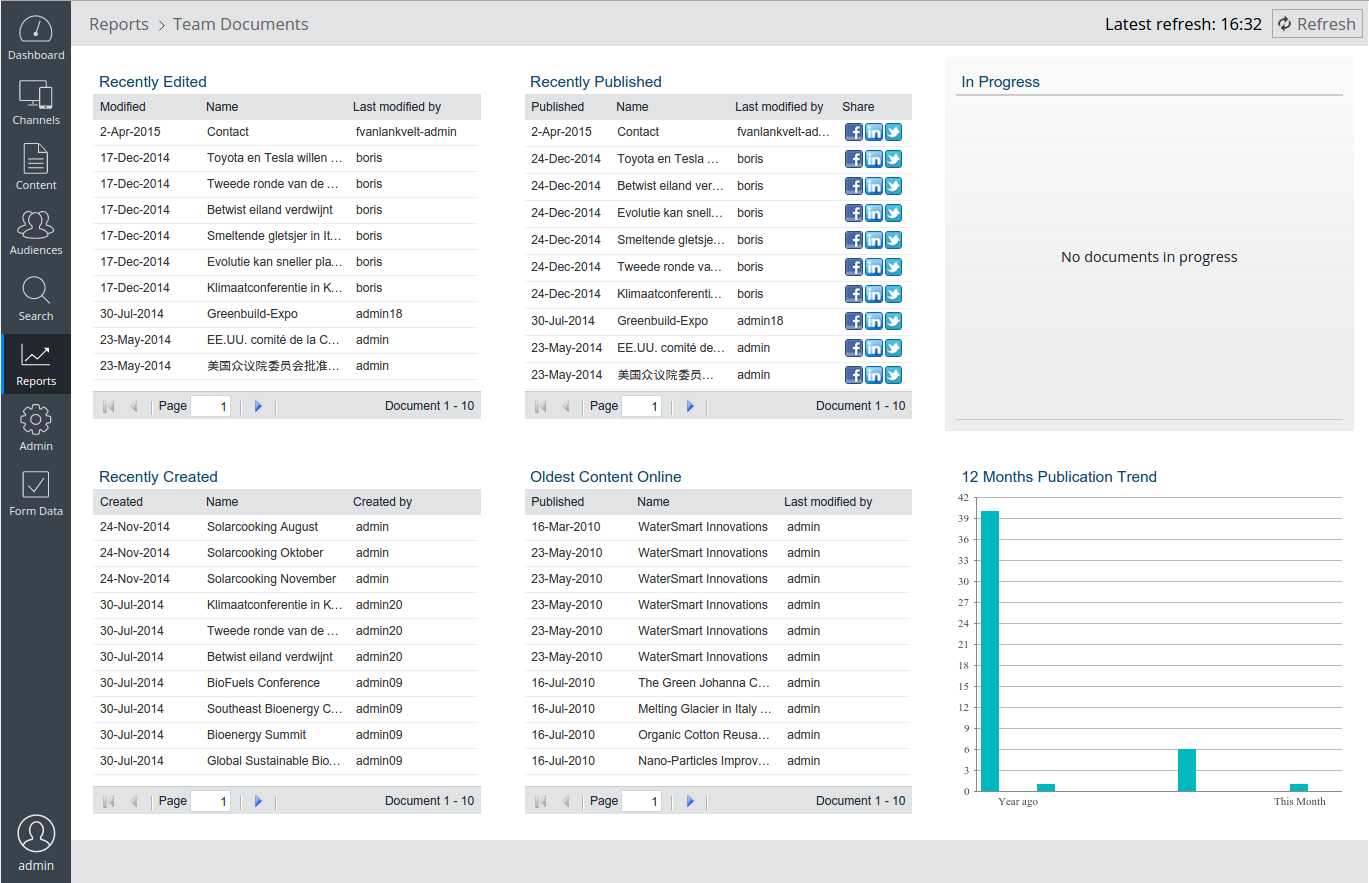
Team Documents
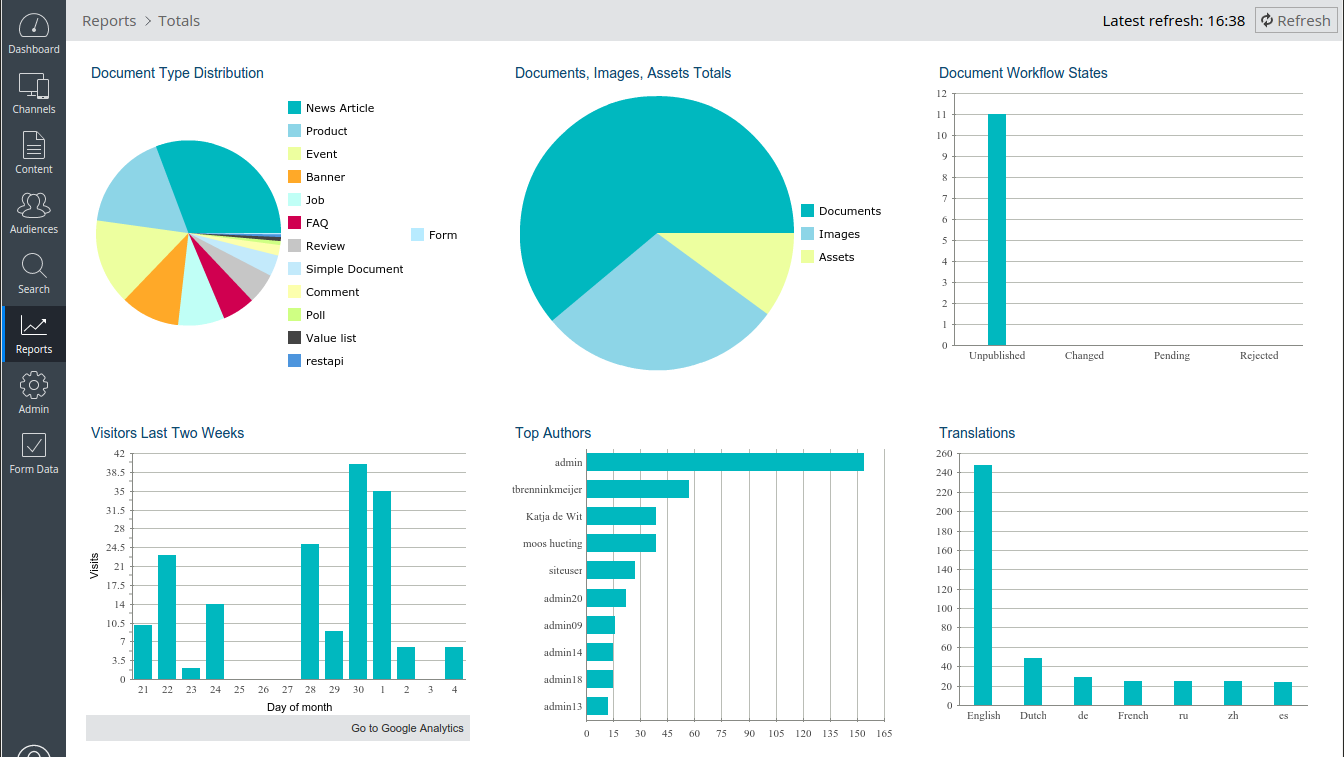
Totals
Buzz
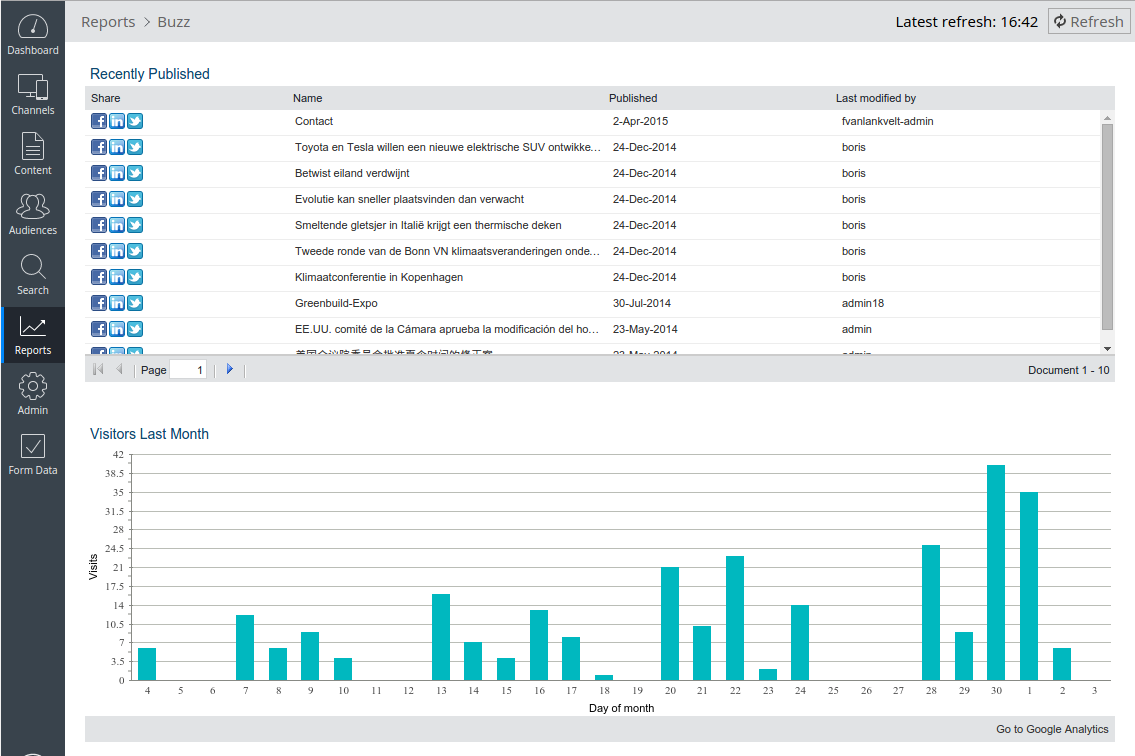
Each report can be configured individually. It is also possible to customize existing reports or add you own ones by modifying configuration.
Developer instructions
Include in Maven project
To include the reporting dashboard in an implementation project, configure the project as Bloomreach Experience Manager project and add the following dependencies to the cms pom.xml:
<dependency>
  <artifactId>hippo-addon-reporting-dashboard-frontend</artifactId>
  <groupId>com.onehippo.cms7</groupId>
</dependency>
<dependency>
  <artifactId>hippo-addon-reporting-dashboard-repository</artifactId>
  <groupId>com.onehippo.cms7</groupId>
</dependency>
Known issue
Several reports rely on hippofacnav:facetnavigation nodes located under /hippo:reports. The hippo:docbase property of these facets is hardcoded as 2c21a29c-a5d1-4e84-aec4-594e5bf93b25, which is the default UUID of the folder /content/documents when creating a new project using the Hippo archetype. If this folder has a different UUID, the reports based on facets will not work and the repository will log an error during startup. To fix this, either set the UUID of /content/documents to 2c21a29c-a5d1-4e84-aec4-594e5bf93b25, or change the hippo:docbase property of the facets under /hippo:reports to the UUID of your /content/documents folder.
Configuration
All configuration of the reporting dashboard is located in the repository at
/hippo:configuration/hippo:frontend/cms/hippo-reports
Each of the nodes specifies either a report, or a report group. The order of the nodes determines the order in which the reports are shown in their group. Reports can be added to and removed from the reporting dashboard by adding and removing report configuration nodes.
Each report is rendered by a CMS plugin. The class name of the plugin is specified via the property plugin.class in each report configuration node. The value of the property wicket.id of each report determines the group the report is part of, and should be one of:
-
service.reports.mydocuments
-
service.reports.teamdocuments
-
service.reports.totals
-
service.reports.buzz
Several reports use facet navigation to fetch their data. All facet navigation nodes used by the reports are located under the root node /hippo:reports.
Reports can be customized to suit the needs of a project using configuration parameters and translations. The translations for reports are managed using repository resource bundles. By convention, the translation data for the report that is configured at:
/hippo:configuration/hippo:frontend/cms/hippo-reports/team-custom-report
Can be found at:
/hippo:configuration/hippo:translations/hippo:reports/team-custom-report
It is good practice to give the reports recognizable names, e.g. 'team-recently-created' for the report 'recently created documents' in the 'team' group.
Generic report configuration
All reports recognize the following configuration properties:
-
background
Whether to render a grey background gradient behind the report
Possible values: true, false
Default: false -
height
Height of the report in pixels.
Default: 340 -
title.color
Name of the title color
Possible values: normal, highlighted, alert
Default: normal -
title.size
Name of the title size
Possible values: normal, large
Default: normal -
width
The width of the report as a fraction (a number between 0 and 1) of the total width of the dashboard.
Default: 0.333
Specific report configuration
Below a specification of the configuration properties and translation keys for each report.
Google Analytics Report
The Google Analytics report show a column chart of the number of unique visitors on a website monitored via Google Analytics.
Configuration options:
-
days
Number of days to show horizontally.
Default: 7 -
plugin.class
Value: com.onehippo.cms7.reports.plugins.ga.GAPlugin
Translation keys:
-
title
Title of the report
The Google Analytics report uses account details configuration that is located at /hippo:configuration/hippo:modules/googleAnalyticsConfiguration/hippo:moduleconfig. It expects that the following properties are available and properly set:
-
hippogoogleanalytics:username
The username you use to log in to the google analytics account. -
hippogoogleanalytics:privateKey
The password you use to log in to the google analytics account. -
hippogoogleanalytics:tableId
The Google Analytics Data Export API table id. You can find this value by going to the Google Analytics Data Export API query explorer.
For configuring these properties follow the instructions provided on Add Google Analytics tracking to your site and the CMS.
Document List Report
The Document List report shows a list of documents fetched from a hippo:resultset node. Typically, these documents are fetched from a hippofacnav:facetnavigation node that determines which documents are actually shown, and in which order.
Configuration options:
-
auto.expand.column
Name of the column whose width should fill all remaining space in the report. If omitted, all columns will have a fixed width. -
columns
Multi-valued string property with the names of the columns to show. These column names are case-sensitive.
Possible values: createdBy, creationDate, lastModificationDate, lastModifiedBy, name, publicationDate, share.
The ' share' column adds a number of buttons per document to share its URL on all social media provided by the CMS social media service. This column requires the properties document.url.service.id and social.media.service.id to be set. -
document.url.service.id
ID of the CMS service to use for creating document URLs. Only needed when the share column is shown. The only valid value is live.site.document.url.service for URLs to the live site (there used to be more options in previous versions). -
facet.path
Absolute path to a node with a ' hippo:resultset' child node that contains the documents to show. All occurences of the value ' $user' in the path are replaced by the name of the current user. -
page.size
Number of documents to show per page. Ignored when paging is disabled.
Default: 10 -
paging
Boolean indicating whether to use paging or not.
Default: true -
plugin.class
Value: com.onehippo.cms7.reports.plugins.documentlist.DocumentListPlugin -
social.media.service.id
ID of the CMS service to access social media (e.g. share URLs)
Value: popup.social.media.service
Translation keys:
-
title
Title of the report -
no-data
Text to show if the report is empty, i.e. there are no documents to list
Chart Report
The Chart Report shows either a column chart or a pie chart. The size of the columns or sectors in the chart comes from a 'chart store'. There are two chart stores: a query chart store that specifies a query per sector, and a facet chart store that reads hippo:count property values in a hippofacnav:facetsavailablenavigation node.
Generic configuration options:
-
chart.type
Type of chart to show.
Possible values: pie, column, bar -
plugin.class
Value: com.onehippo.cms7.reports.plugins.chart.ChartPlugin
Configuration options for a facet chart store:
-
store.class
Value: com.onehippo.cms7.reports.plugins.chart.FacetChartStore -
facet.path
Absolute path to the a hippofacnav:facetsubnavigation node. All child nodes of the type hippofacnav:facetsubnavigation are considered to be a column or a pie sector. Their sizes are determined by their hippo:count property values.
All occurences of the value ' $user' in the facet path are substituted with the name of the user that is currently logged in. -
hide.untranslated.labels
Whether to hide all facet names that are not translated. When false, untranslated facet names are shown as-is. When true, untranslated facet names are not shown at all. This property is not used for pie-charts.
Possible values: true, false
Default: false
Configuration options for a query chart store:
-
store.class
Value: com.onehippo.cms7.reports.plugins.chart.QueryChartStore -
sector.names
Multi-valued string property containing the names of the columns or pie sectors. -
sector.queries
Multi-valued string property containing the xpath queries to execute for each sector.
All occurrences of the value ' $user' in each query are substituted with the name of the user that is currently logged in.
Sector name N matches query N. The number of sector names and queries should match.
Translation keys:
-
title
Title of the report -
no-data
Text to show if the report is empty, i.e. all sectors have the value zero -
<facet name>
Each facet name found by a facet chart store can be translated. Untranslated facet names are shown as-is, unless the property 'hide.untranslated.labels' is set to true. -
<sector name>
Each sector name used by a query chart store can be translated. Untranslated sector names are shown as-is.
Position of the reporting dashboard icon
The reporting dashboard is loaded via the configuration node
/hippo:configuration/hippo:frontend/cms/cms-static/reportsPerspective
The position of this node among its siblings determines the position of the reporting dashboard icon. By default, it is positioned above the Admin perspective.
Tweaking existing reports
The document list reports and some of the chart reports get their data from a hippofacnav:facetnavigation node. Such a report can be tweaked by tweaking the faceted navigation configuration behind it. The path of the facet navigation node used by a report is specified in its configuration property facet.path (see above).
For example, certain users can be excluded from the 'top authors' report by modifying its faceted navigation configuration. A common use case is a user 'importer' used by some automatic importer process. To prevent this 'importer' user from showing up as a top author, add a filter to the faceted navigation configuration node used by the top authors report:
/hippo:reports/facet-createdby:
  hippofacnav:filters: hippostdpubwf:createdBy != importer
For more options, see Configure Faceted Navigation.

