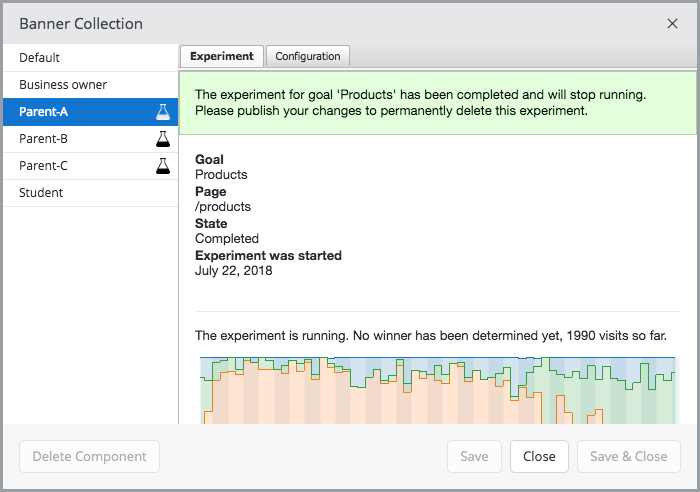
Monitor an Experiment
Once you have created an experiment, you can monitor its progress.
Open the Channels perspective.
Open the Channel in which the experiment you want to monitor is running.
Browse to the page on which the experiment is running.
If the components on the page are not outlined, click on the Show components icon in the top right corner.

Click on the component that is part of the experiment you want to monitor to open the component dialog.
In addition to the component's configuration it now contains an Experiment tab showing the progress of the experiment:
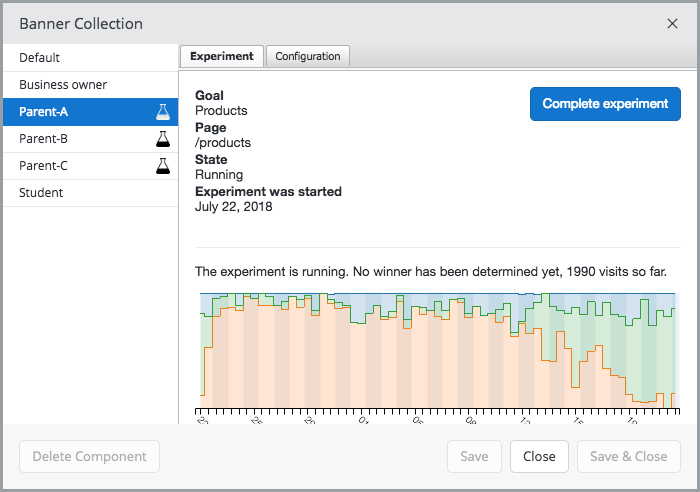
For each experiment, the following data is shown:
- Goal name and page
- State (Created, Running, Completed)
- Whether a winner has been determined
- The sample size (i.e. number of visits)
- A chart showing the experiment's progress.
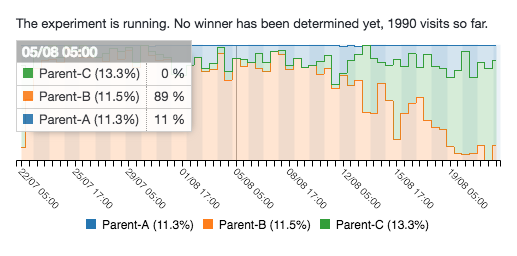
The charts show the progress of the experiment over time. For each variant it shows which percentage (of total requests) is served to the visitors (in the graph):
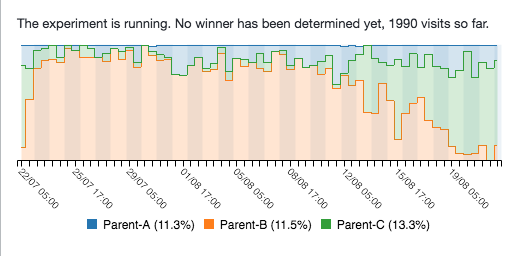
By default, the chart shows the data from the entire timespan the experiment has been running. You can zoom into a shorter timespan using the scroll wheel of your mouse:
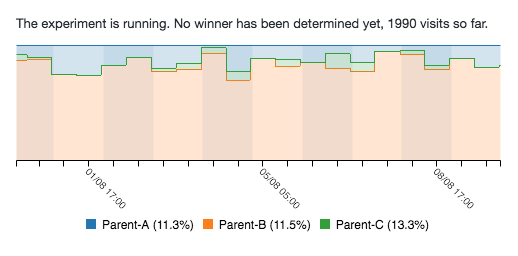
Numerical values pop up when hovering over the chart with your mouse:
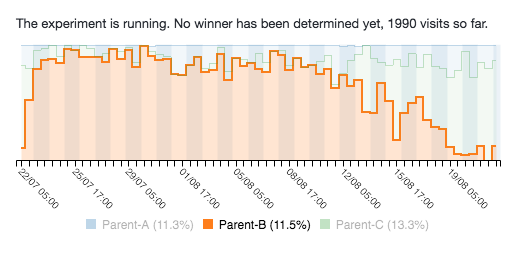
By hovering the mouse pointer over the variant names in the legend in the chart area you can hide or show specific data in the chart:
When the system is over 95% certain that one variant performs better than the others, it will declare that variant the winner. The experiment will keep running until you decide to end it.
To end the experiment click on Complete Experiment. Close the component dialog and save and publish your changes to actually stop the experiment.
