Trends Scores
Introduction
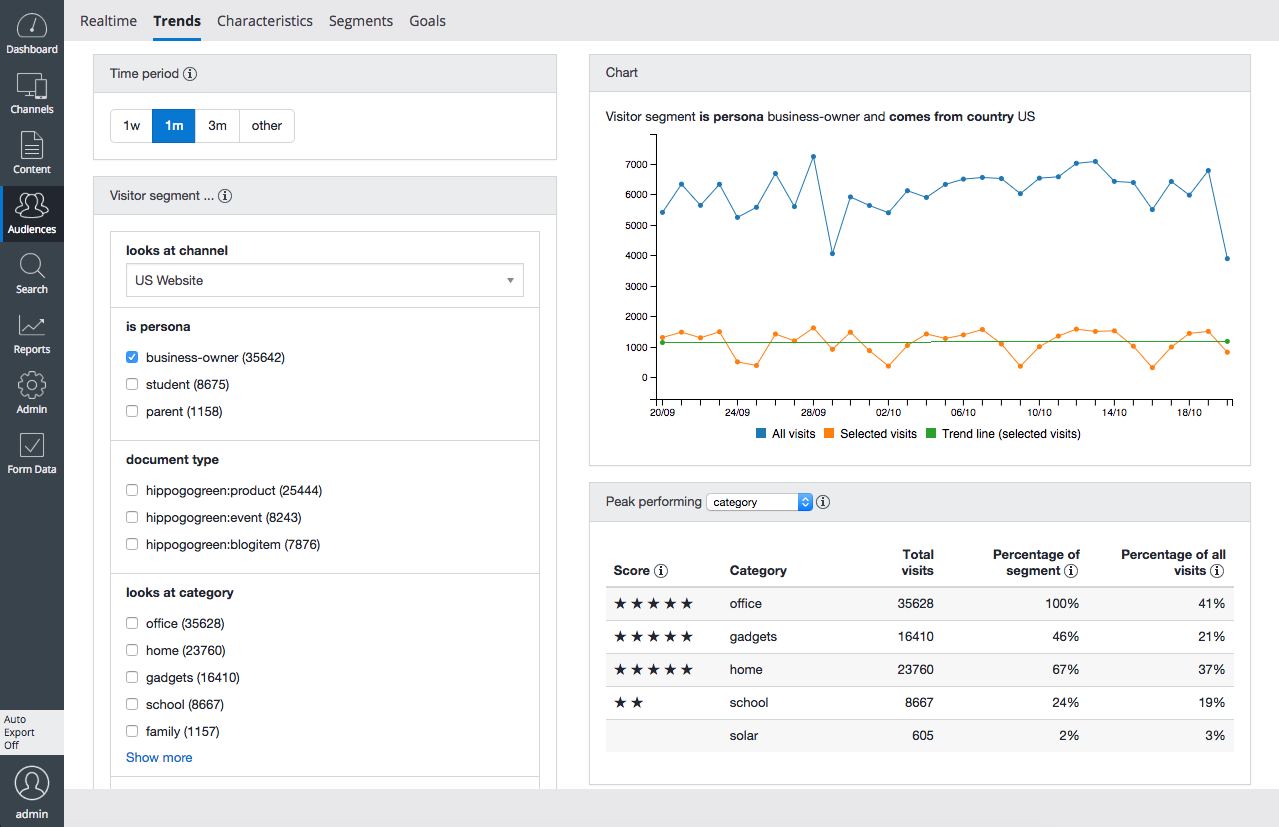
The Trends tab in the Audiences perspective includes a Top N list of peak performing categories. Each category is assigned a score of at most 5 stars. This page explains how the scores are computed.
How Scores are Computed
The number of stars for an item is computed in the following way: let f (foreground) be the frequency of the item in the selection. For example, in the screenshot above, 'energy' has f=0.38. Let b (background) be the frequency of the item in the full population, for example, 'energy' has b=0.09. The 'score' for item 'energy' is then set to s=(f-b)(f/b).
There are two ways to get a high score:
- An item which increases from 4% to 8% benefits primarily from the f/b term.
- An item which increases from 50% to 60% benefits primarily from the f-b term.
In principle, the scores can be arbitrarily large. The number of stars shown in the Score column is defined as stars = floor(6s/(|s|+c)) with c=0.1 chosen empirically.