

The requests overview dashboard
When the dashboard is installed (see Installation), a CMS user sees an entry "Translation requests" below the "Extension" menu. It shows an overview of all translation requests in the repository.
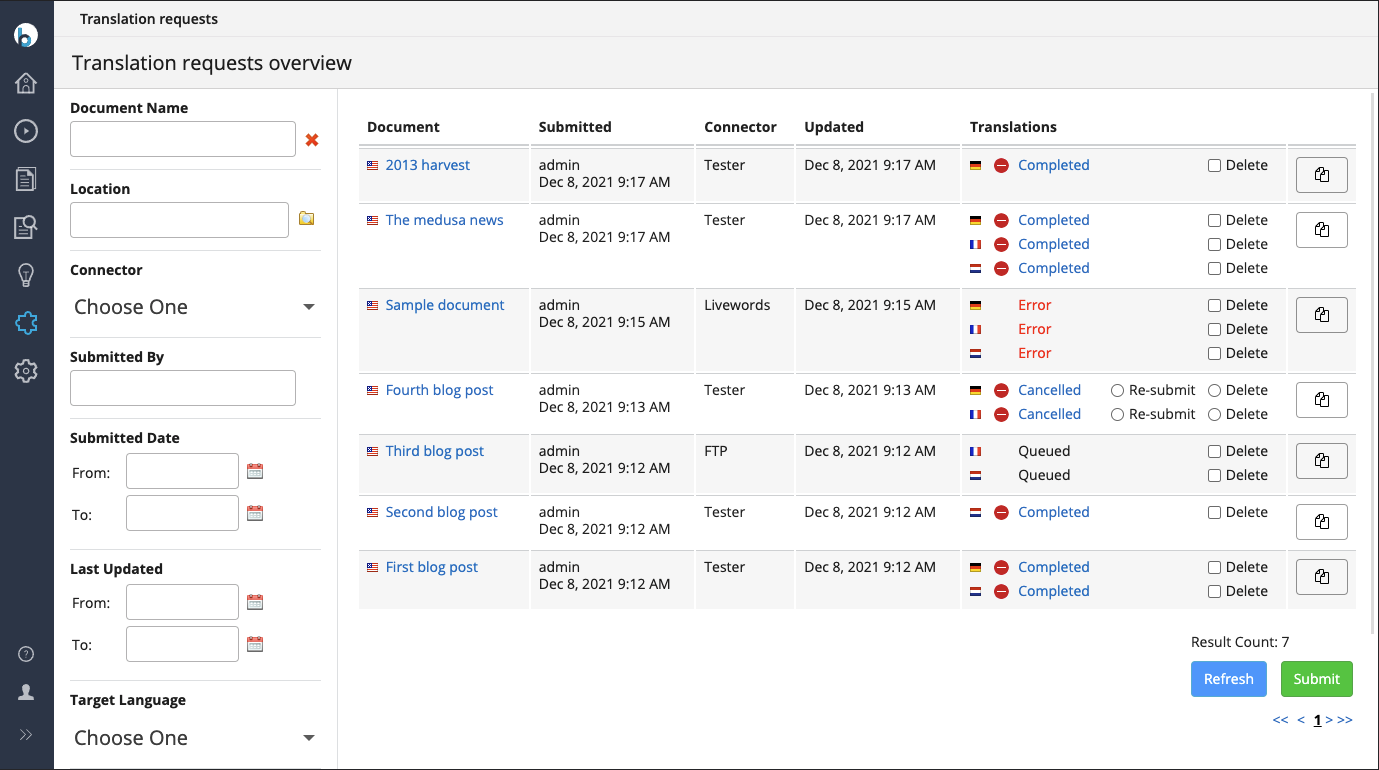
See above the 5.6.0 version of the dashboard. Below 5.6.0, there are no filters on the left hand side.
The dashboard shows an overview of translation requests: each row represents a submitted request for a source document. The table shows:
Document: clickable link to the source document the request was made for.
Submitted: the user that did the request and the date/time of the submission.
Connector: the short hand name for the connector that was used in the request.
Updated: the date/time this request was last updated, meaning for a completed request when a translation for the document has been submitted into the system.
Translations: status of the request per language (it is possible to select multiple target languages, within one request). It shows:
- a flag indicating the target language, with on its hover the locale code
- a publication status icon in case there is a translated document, with on its hover 'Live', 'Offine' or 'Previous version live'.
- a request status text indicating the progress of the request: Queued, Submitted, Cancelled, Completed, Error.
If Error, its hover shows a more detailed error, and (from version 8.1.2) it's clickable and opens an Error details modal - see Target-Level Translation Errors below.
If Completed it's a clickable link to the target. An asterisk (*) behind it indicates it's a completed translation that is new within the logged-in CMS session.
Actions: one or two actions are available, depending on the request status.
- Cancel shows if the translation request is submitted to the external system and has not come back yet.
The action will call the external system to cancel the request. - Re-submit shows if a translation request has been cancelled earlier.
The action will do a new transaltion request for the document in the target language(s) involved. - Delete shows if the translation request has been cancelled earlier, or if it is completed, i.e. has come back from the external system.
The action will not call the external system but delete the request from the Hippo repository.
Note: the Cancel (and therefore also the Re-submit) actions are not available if the configured connector does not support cancellations, e.g. the LiveWords connector.
Copy button: for convenience, a button to copy a table row to the clipboard. Can include some extra attributes, specific to the connector used.
Rows That Fail to Load
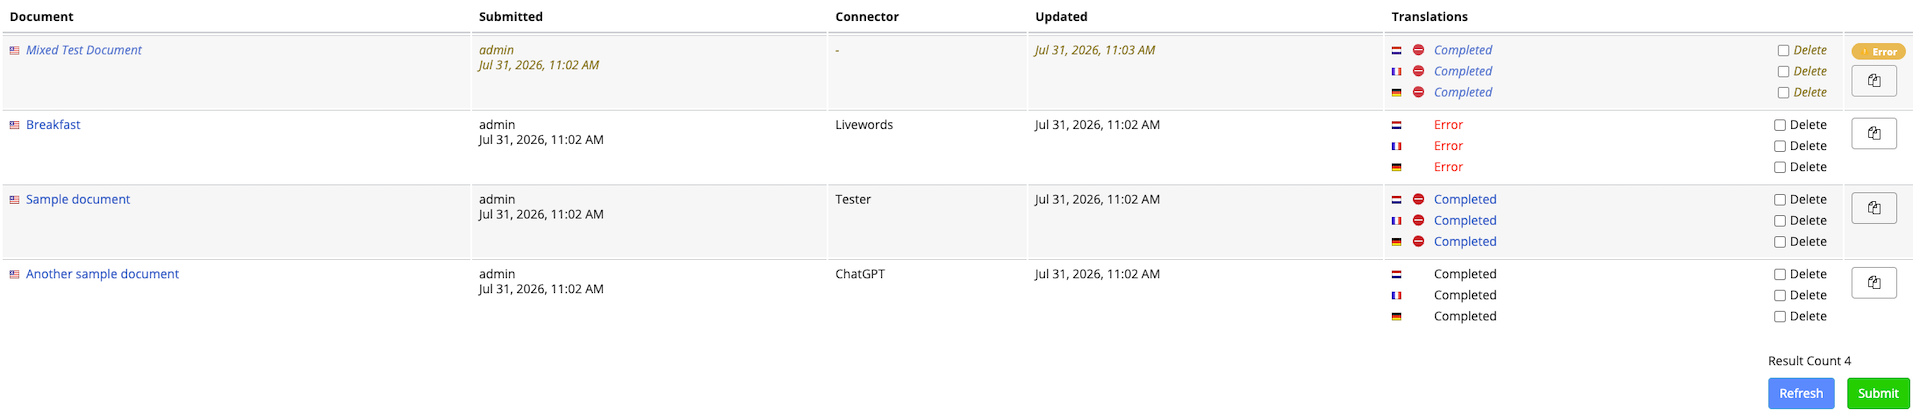
From version 8.1.0, a row whose job node is corrupt, incomplete, or otherwise unreadable no longer breaks the dashboard. Instead, that single row degrades gracefully:
- The row is tinted amber (amber left border, pale amber background, italic muted text) to distinguish it from normal rows.
- An amber Error badge with a warning icon appears on the row. Hovering it shows a short summary; clicking it opens a modal with:
- Job item ID and Document ID
- The underlying error type and message
- Copy (copies all of the above to the clipboard as plain text) and Close buttons
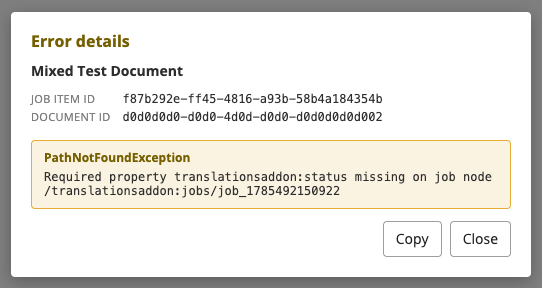
Note: This "Error" state is distinct from the Error request status described above under Translations. A request status of Error covers two different underlying causes, both surfaced with the same hover:
- The request never reached the external system at all - hovering shows "The translation request has failed and did not reach the external system." This case is retried automatically by the RetryTranslationRequests scheduler job, up to its configured `maxRetry` attempts.
- The external system received the request but reported a failure - hovering shows the connector's own error message instead.
A degraded row or target, by contrast, means the dashboard couldn't even read that job or target's data from the repository - hovering or opening the modal shows a data-corruption message ("...could not be fully loaded - the...node may be corrupt or missing. Check the server log for details.") rather than either of the above. All three surface as the word "Error," but only the repository-corruption case is a dashboard/UI bug candidate - the other two are the external integration or the network doing exactly what they're supposed to do when something fails upstream.
Target-Level Translation Errors
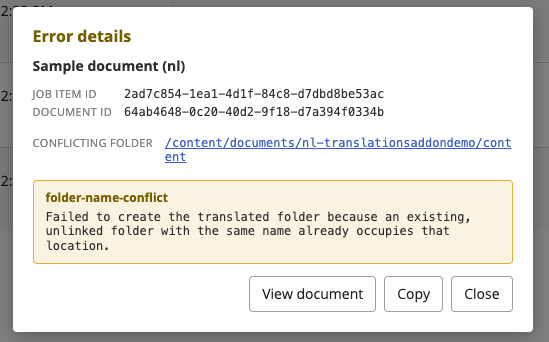
From version 8.1.2, an Error status shown against a target language is clickable and opens an Error details modal for that target, showing:
- Document name, with the target locale appended (e.g. "Sample document (de_DE)")
- Job item ID and Document ID
- The error type and message
- One extra detail row, depending on the cause (only one shows at a time):
- Conflicting folder - a clickable link that opens the conflicting folder directly in the content perspective, reliable even when the CMS is served behind a reverse proxy that rewrites its externally visible path prefix
- Import failure detail
- Missing translation detail
- Connector failure detail - includes the ChatGPT and Star connectors' own failure reason, where previously these connectors only reported a generic Error status
- View document, Copy, and Close buttons
Targets That Fail to Load
Also from version 8.1.2, a target whose own data can't be read from the repository (its node is corrupt or missing) degrades gracefully rather than breaking the row: it shows an amber Error badge, and clicking it opens the same Error details modal with a message indicating the target's data could not be fully loaded.